Guide

Dirt & aggregate statistics: Sand, gravel & crushed stone production by state

Texas leads the country in crushed stone and in sand & gravel. Here is each state's published 2025 output, plus what a ton costs at the pit.

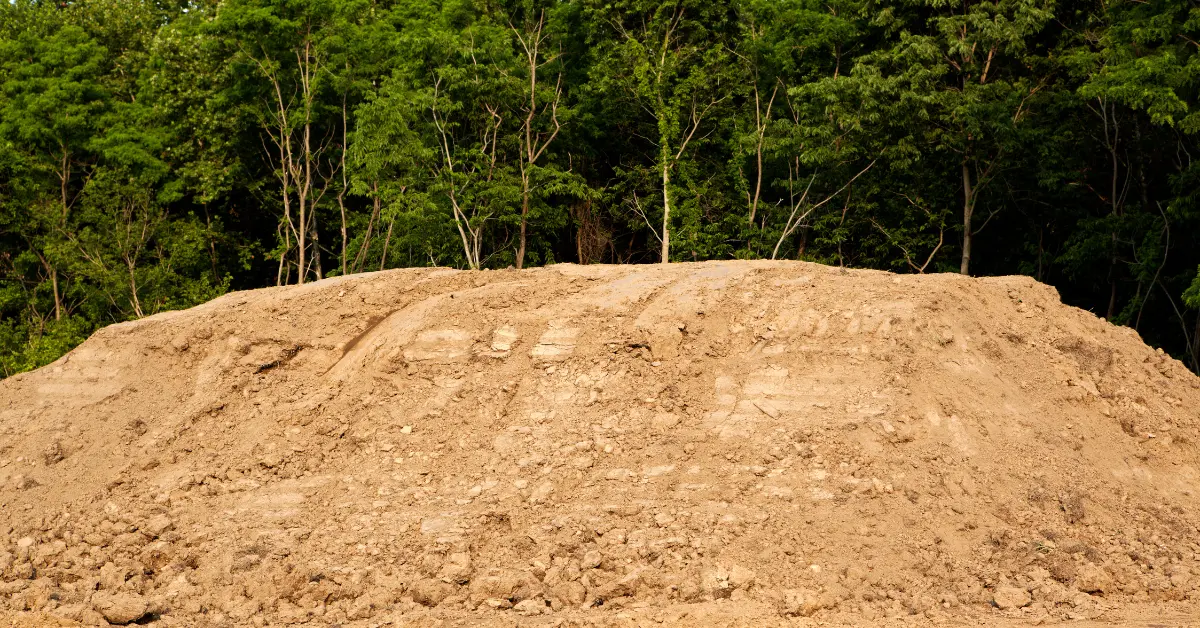
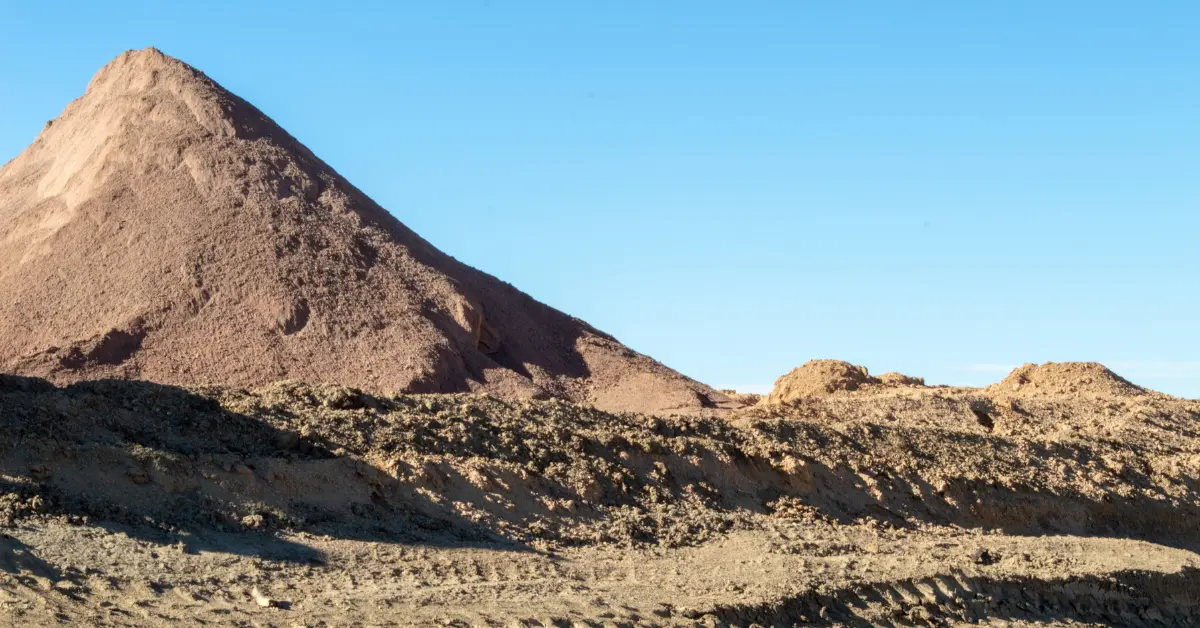
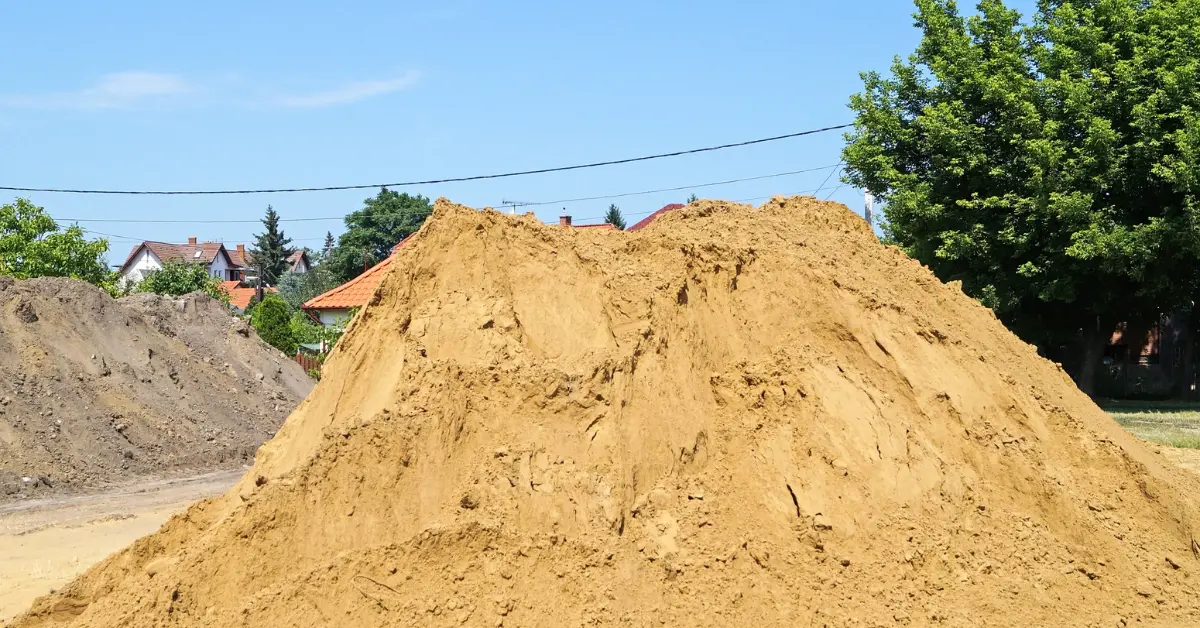
Large pile of construction sand beside a residential street.

Soil Connect by the numbers

34%

average savings on dirt & hauling costs

  • 2019matching sites that have dirt with sites that need it since
  • 24 hrsfastest payout for haulers moving dirt
  • Daysto several matches for excess dirt, per Pittman Partners
  • 3 in 1Marketplace, Reporting & Hauling in one place

Ready for your next import or export?

Get Started

TL;DR

Construction aggregate is two USGS commodities added together, crushed stone and construction sand and gravel. Neither survey counts site dirt, so aggregates stand in as the closest public proxy. Gravel prices and aggregate prices here are producer values at the pit or quarry, and trucking is added on top to reach the delivered number.

Key construction aggregate statistics

  • 1.5 billion metric tons of crushed stone produced in the US (Source: USGS, 2025 estimate)
  • 870 million metric tons of construction sand & gravel produced (Source: USGS, 2025 estimate)
  • $18.50 per metric ton, average value of crushed stone at the quarry (Source: USGS, 2025 estimate)
  • +6.3% producer prices for sand, gravel & crushed stone in 12 months (Source: BLS, Sep 2026)

Aggregate production by state

Texas produced 192 million metric tons of crushed stone and 100 million of sand and gravel in 2025, more than any other state in both, per USGS quarterly survey estimates. California was second in sand and gravel at 88 million tons and Missouri second in crushed stone at 92 million.

Both tables use the newest state figures USGS has published: 2025 estimates released September 2026, with the second quarter of 2026 for direction. National series: the USGS mineral commodity data page. Sizes and uses: Soil Connect's crushed stone FAQs.

Million metric tons, crushed stone plus sand & gravel, 2025 estimate

Table: Top 10 states for construction aggregates

| Group | Million metric tons, crushed stone plus sand & gravel |

| Texas | 292 |

| California | 129 |

| Florida | 107 |

| Ohio | 102 |

| Missouri | 101 |

| Pennsylvania | 92.9 |

| New York | 75.4 |

| North Carolina | 71.7 |

| Michigan | 69.8 |

| Illinois | 69.6 |

Source: USGS, 2025 estimate

  • Share of crushed stone from the 10 leading states: 56% of US crushed stone came from the 10 leading states in USGS's February 2026 summary, Texas, Pennsylvania and Florida first. (Source: USGS, 2025 estimate)
  • Aggregate production in the second quarter of 2026: 674 million metric tons of construction aggregates shipped for consumption, up 5.7% from the second quarter of 2025. (Source: USGS, Q2 2026)

Production is up in 2026 in most states that report quarterly. Texas and California stay on top.

Crushed stone output

USGS estimates 1.5 billion metric tons in 2025, about 70% of it limestone and dolomite. Second-quarter 2026 shipments reached 413 million tons, up 6.8% on the same quarter of 2025, led by Texas, Pennsylvania, Missouri, Florida and Ohio. Delaware, Louisiana and Nebraska are withheld, and Alaska, Hawaii, Montana and North Dakota sit outside the quarterly sample, so their change column reads n/a.

Table: Crushed stone sold or used, by state

| State | 2025, thousand metric tons | Q2 2026 change |

| Texas | 192,000 | -3.1% |

| Missouri | 91,700 | +0.4% |

| Pennsylvania | 83,400 | +14.0% |

| Florida | 81,500 | +8.1% |

| Ohio | 72,300 | +8.2% |

| North Carolina | 62,700 | +20.2% |

| Tennessee | 61,600 | -4.7% |

| Georgia | 59,500 | +6.9% |

| Indiana | 54,800 | +9.2% |

| Kentucky | 53,800 | +4.8% |

| Virginia | 52,500 | +8.0% |

| Illinois | 50,900 | +1.7% |

| New York | 43,800 | +15.2% |

| Oklahoma | 41,000 | +20.1% |

| California | 40,600 | +5.6% |

| Alabama | 40,000 | +9.0% |

| South Carolina | 34,100 | +13.6% |

| Arkansas | 32,600 | +5.2% |

| Iowa | 30,900 | +7.3% |

| Michigan | 28,900 | +11.8% |

| Wisconsin | 25,300 | -2.8% |

| Maryland | 24,800 | +7.9% |

| Oregon | 22,800 | +3.5% |

| New Jersey | 17,100 | +7.9% |

| Kansas | 16,000 | -25.5% |

| West Virginia | 14,400 | +1.8% |

| Washington | 13,500 | -16.5% |

| Colorado | 12,300 | +33.3% |

| Utah | 12,100 | -19.0% |

| Arizona | 11,900 | -6.0% |

| Massachusetts | 10,800 | -1.2% |

| Nevada | 10,000 | +21.0% |

| Minnesota | 9,670 | +49.7% |

| Connecticut | 9,080 | +1.3% |

| Wyoming | 8,460 | +10.1% |

| South Dakota | 7,600 | -5.3% |

| Hawaii | 5,820 | n/a |

| Idaho | 5,100 | +15.9% |

| New Hampshire | 4,810 | -10.8% |

| Vermont | 4,180 | +12.7% |

| Maine | 4,100 | -14.3% |

| New Mexico | 2,970 | +25.2% |

| Montana | 2,930 | n/a |

| Rhode Island | 2,450 | +20.7% |

| Mississippi | 2,180 | +10.2% |

| Alaska | 485 | n/a |

| North Dakota | 94 | n/a |

| Delaware | n/a | n/a |

| Louisiana | n/a | n/a |

| Nebraska | n/a | n/a |

Source: USGS, 2025 estimate, Q2 2026

Sand & gravel output

Construction sand and gravel came from an estimated 3,400 companies and 6,500 pits in 2025. In the second quarter of 2026, California, Texas, Minnesota, Arizona and Nevada led, and national shipments of 261 million tons were 4.0% above the same quarter of 2025. Eight states outside the quarterly sample read n/a.

Table: Construction sand & gravel sold or used, by state

| State | 2025, thousand metric tons | Q2 2026 change |

| Texas | 100,000 | -0.8% |

| California | 88,300 | +2.7% |

| Arizona | 51,300 | +0.2% |

| Minnesota | 49,100 | +72.3% |

| Michigan | 40,900 | -25.8% |

| Utah | 38,600 | -10.5% |

| Colorado | 33,300 | +6.5% |

| New York | 31,600 | +6.8% |

| Washington | 29,900 | -6.6% |

| Ohio | 29,500 | +8.0% |

| Wisconsin | 29,000 | n/a |

| Nevada | 26,800 | +62.8% |

| Florida | 25,200 | +8.2% |

| Idaho | 22,600 | +7.7% |

| Illinois | 18,600 | n/a |

| Louisiana | 15,100 | +16.0% |

| Indiana | 13,400 | -1.8% |

| North Dakota | 13,300 | n/a |

| Alabama | 13,200 | n/a |

| Wyoming | 13,000 | -31.9% |

| Iowa | 12,300 | -9.0% |

| Montana | 12,200 | -5.3% |

| Maine | 12,100 | +25.1% |

| Oklahoma | 11,800 | +18.1% |

| South Carolina | 11,600 | +91.9% |

| New Jersey | 11,100 | -18.9% |

| Oregon | 11,100 | -12.1% |

| Nebraska | 10,600 | -8.0% |

| South Dakota | 10,300 | -0.3% |

| Massachusetts | 10,200 | n/a |

| Mississippi | 9,650 | +7.3% |

| Pennsylvania | 9,540 | +32.8% |

| New Mexico | 9,170 | -15.6% |

| Missouri | 9,110 | -0.5% |

| Kansas | 9,030 | -23.3% |

| North Carolina | 8,930 | +26.3% |

| Kentucky | 8,700 | +9.4% |

| Georgia | 8,260 | +16.6% |

| Arkansas | 7,740 | +6.9% |

| Virginia | 7,360 | +10.3% |

| New Hampshire | 6,560 | -20.0% |

| Maryland | 6,510 | +26.5% |

| Tennessee | 6,220 | -0.4% |

| Alaska | 4,990 | n/a |

| Connecticut | 4,530 | +17.3% |

| Rhode Island | 4,090 | n/a |

| Vermont | 3,480 | -6.9% |

| Delaware | 1,690 | -21.1% |

| West Virginia | 848 | -10.0% |

| Hawaii | 589 | n/a |

Source: USGS, 2025 estimate, Q2 2026

Gravel prices & aggregate prices

An estimated $18.50 per metric ton was the average crushed stone price at the quarry in 2025, and construction sand and gravel averaged $14.50, per USGS. Both are producer values before trucking, so the delivered gravel price per ton will be higher. Our post on the trip from quarry to jobsite covers the add-ons.

Sand prices have no single USGS figure. The closest split is by end use, below, and it shows the gravel cost for a job depends on the grade as well as the state.

Construction sand & gravel price: $14.50 per metric ton average producer value, up from an estimated $13.90 in 2024. (Source: USGS, 2025 estimate)
  • Crushed stone price: $18.50 per metric ton average producer value, up from an estimated $17.50 in 2024. (Source: USGS, 2025 estimate)
  • Fill grade sand & gravel: $11.87 per metric ton average value of sand & gravel sold as fill. Concrete aggregate averaged $15.00 and road base $10.60. (Source: USGS Minerals Yearbook, 2023)
  • Sand & gravel mining producer prices: +7.5% producer price index change for construction sand and gravel mining, September 2025 to September 2026. Preliminary. (Source: BLS, Sep 2026)
  • Crushed limestone producer prices: +6.0% producer price index change for crushed and broken limestone mining, same months. (Source: BLS, Sep 2026)

A gravel cost quoted without a haul distance is half a number.

Gravel price per ton trends

Construction sand and gravel rose from an average $10.52 a metric ton in 2021 to an estimated $14.50 in 2025, up 38%, and crushed stone went from $13.26 to $18.50, up 40%. Still rising: BLS's producer price index for the group was 6.3% higher in September 2026 than a year earlier.

Dollars, 2021 to 2025

Table: Construction sand & gravel, average value per metric ton

| Year | Dollars |

| 2021 | $10.52 |

| 2022 | $11.35 |

| 2023 | $12.54 |

| 2024 | $13.90 |

| 2025 | $14.50 |

Source: USGS, 2021 to 2025

Crushed stone prices by region

Crushed stone prices vary more by region than by year. In 2023, the newest yearbook count, South Atlantic producers averaged about $21 a metric ton at the quarry while West North Central producers averaged under $10. USGS's 2025 estimates point the same way, about $24.67 against $10.12. Each is value divided by tons, an average across every grade sold, not a product quote.

Among states, Georgia reported the highest average unit value in 2023 at $24.76 a metric ton and Idaho the lowest at $7.50, leaving aside Mississippi, which USGS flags for stone shipped in from other states.

Table: Crushed stone, average value per metric ton by division

| Division | 2023 | 2019 | Change |

| South Atlantic | $21.04 | $16.14 | +30% |

| East South Central | $17.75 | $13.04 | +36% |

| Middle Atlantic | $17.72 | $13.77 | +29% |

| New England | $15.22 | $12.48 | +22% |

| West South Central | $14.82 | $11.29 | +31% |

| Pacific | $14.45 | $11.78 | +23% |

| East North Central | $12.89 | $9.79 | +32% |

| Mountain | $11.94 | $9.01 | +33% |

| West North Central | $9.94 | $9.07 | +10% |

Source: USGS Minerals Yearbook, USGS Minerals Yearbook, 2019 and 2023

What aggregate demand means for builders

Roads and concrete are the largest uses USGS names. USGS estimates that 72% of crushed stone was used as construction aggregate in 2025, mostly for road construction and maintenance, and that 42% of construction sand and gravel went to concrete aggregate and 20% to road base and coverings. Our post on the growing demand for gravel covers project types.

For 2026, USGS expected capital investment in manufacturing, energy and data-center facilities, plus federal and state infrastructure funding, to support continued demand. USGS also noted in February 2026 that the 2021 Infrastructure Investment and Jobs Act's highway funding would expire at the end of fiscal year 2026. Congress has since extended those authorizations to December 11, 2026.

Dirt and aggregate decisions land on the same estimate. The weight fill can carry depends on its moisture content, particle size and strength. Read how aggregate affects site stability first.

Crushed stone used as construction aggregate: 72% of crushed stone went to construction aggregate, mostly road construction and maintenance. (Source: USGS, 2025 estimate)
  • Where construction sand & gravel goes: 42% of construction sand & gravel became concrete aggregate, 20% road base, 12% construction fill, 9% asphalt. (Source: USGS, 2025 estimate)
  • Federal highway authorization: Dec 11, 2026 new expiry of the IIJA highway authorizations, extended by P.L. 119-103. (Source: CRS, Sep 2026)
  • Estimated vs actual dirt volumes: 24% to 30% difference between estimated dirt import and export volumes and the actual amount moved, per Soil Connect data. (Source: Soil Connect, as listed Nov 2026)
  • Soil Connect customer savings on dirt: 28% to 42% what customers save on their dirt, with 34% the average across dirt & hauling, per Soil Connect. (Source: Soil Connect, as listed Nov 2026: Get Rid of Dirt page for 28% to 42%, home page for 34%)

Price the haul, then check the quantity. Create an RFQ or Post and learn how much dirt and aggregate near you actually cost.

Methodology & sources

  • No federal survey counts construction site dirt. USGS aggregate data stands in, and each figure names its commodity.
  • State tables come from the USGS Mineral Industry Surveys for the second quarter of 2026 (September 2026). Their 2025 figures are USGS estimates built on the 2024 Minerals Yearbook and 2025 quarterly surveys. Withheld states read n/a, never estimated.
  • National totals, leading states, end uses and unit values come from the Mineral Commodity Summaries 2026, where 2024 and 2025 are estimates. The September survey table totals 923 million tons of sand and gravel for 2025 against the summary's 870 million. All values are producer values at the pit or quarry, in metric tons.
  • Regional prices are our division: reported value over reported tons in the 2023 and 2019 Minerals Yearbook crushed stone tables, and in the 2025 survey table, whose dollar values are USGS estimates based on the 2024 yearbook. Prices by use come from the 2023 sand and gravel tables and cover the 26% of tonnage with a reported use. Producer price changes divide the preliminary BLS index for September 2026 by September 2025.
  • Soil Connect numbers come from soilconnect.com in Soil Connect's wording and are not independently audited.

All sources, checked November 6, 2026

  1. U.S. Geological Survey, Mineral Commodity Summaries 2026: Sand and gravel (construction)
  2. U.S. Geological Survey, Mineral Commodity Summaries 2026: Stone (crushed)
  3. U.S. Geological Survey, Mineral Industry Surveys: Crushed stone and sand and gravel in the second quarter 2026 (September 2026), tables 1 to 6
  4. U.S. Geological Survey, 2023 Minerals Yearbook: Stone (crushed), tables-only release, tables 3 and 4
  5. U.S. Geological Survey, 2023 Minerals Yearbook: Sand and gravel (construction), tables-only release, tables 3 and 5
  6. U.S. Geological Survey, 2019 Minerals Yearbook: Stone (crushed), table 3
  7. Bureau of Labor Statistics, Producer Price Index, series WPU1321: Construction sand, gravel and crushed stone
  8. Bureau of Labor Statistics, Producer Price Index, series PCU212321212321: Construction sand and gravel mining
  9. Bureau of Labor Statistics, Producer Price Index, series PCU212312212312: Crushed and broken limestone mining
  10. Congressional Research Service, R48845, Surface Transportation Reauthorization: Federal Highway Programs, updated September 8, 2026
  11. Soil Connect, Dirt Reports page
  12. Soil Connect, Get Rid of Dirt page
  13. Soil Connect, home page
Key stats Production Prices For builders Sources

Aggregate statistics FAQ

Frequently asked questions

Which state produces the most crushed stone?

Texas. USGS quarterly survey estimates put Texas at 192 million metric tons of crushed stone in 2025, about 13% of the national 1.48 billion, with Missouri at 92 million, Pennsylvania 83 million and Florida 82 million. USGS's February 2026 summary lists Pennsylvania and Florida ahead of Missouri, and Pennsylvania outproduced Missouri in the second quarter of 2026, so only Texas's lead holds across releases.

Why are gravel prices rising?

USGS expected shortages near metropolitan areas and higher fuel costs to push prices up in 2026, as local zoning and land-development alternatives move new pits away from population centers. Those are USGS expectations, not a measured cause.

The rise itself is measured: construction sand and gravel averaged $10.52 a metric ton in 2021 and an estimated $14.50 in 2025, and the BLS producer index for sand, gravel and crushed stone rose 6.3% in the 12 months to September 2026.

How much does sand cost per ton?

USGS publishes no single sand price. The closest all-in figure is $14.50 per metric ton for all construction sand and gravel in 2025, a producer value at the pit. By use in 2023, masonry sand averaged $14.45 a metric ton and plaster and gunite sands $18.04, while concrete aggregate including concrete sand averaged $15.00, fill $11.87 and road base $10.60. Delivered cost adds the haul. Create an RFQ or Post to learn what sand near you actually costs.

Dirt & aggregate guides

Keep reading

View all posts

The Nation's Largest Dirt Marketplace

Create an RFQ or Post and learn how much dirt near you actually costs.
Get Started

Dirt & aggregate statistics: Sand, gravel & crushed stone production by state

Dirt & aggregate statistics: Sand, gravel & crushed stone production by state
November 11, 2026

Explore Other

Blog Posts

Brownfield statistics: Contaminated construction site dirt by the numbers

EPA still works from a 450,000 to 1 million brownfield estimate. Here are the measured counts, grant dollars and public disposal rates.

Read more
Dirt & aggregate statistics: Sand, gravel & crushed stone production by state

Texas leads the country in crushed stone and in sand & gravel. Here is each state's published 2025 output, plus what a ton costs at the pit.

Read more
Construction & demolition waste statistics: Where construction site dirt ends up

EPA counted 600 million tons of C&D debris in 2018 across seven materials, none of them soil. What it covers, what it skips, what Soil Connect sees.

Read more
Landfill tipping fee statistics by state: What dumping construction dirt costs

EREF's state averages, 15 public rate schedules and what one load of dirt costs.
Read more
Road base vs gravel: What belongs under driveways, pads & roads

Road base goes under anything that carries wheels, because its fines compact into a hard layer. Clean gravel goes where water has to move.

Read more
Engineered fill vs structural fill: How the specs differ

Structural fill names the job: carrying a load. Engineered fill names the method: placed in lifts and tested to a geotech's spec. Fill under a footing usually has to be both.

Read more
How to get dump truck contracts as an owner-operator

Get legal and insured first, then get on contractor and DOT plan holder lists, join dirt marketplaces and bill with digital tickets so contractors pay faster.

Read more
Soil classification guide: USCS & AASHTO explained for builders

Two lab tests, a sieve analysis and the Atterberg limits, turn a bag of dirt into a symbol like CL or A-6. Here is how to read both systems.

Read more
Soil stabilization guide: Lime, cement & mechanical methods

Lime fixes plastic clay, cement binds sandy soil, and geosynthetics carry aggregate over soft subgrade. Soil tests pick the method, and the mix design sets the dose.

Read more
Construction aggregates guide: Types, sizes & how to order

Order aggregate by its spec number and gradation, not by a yard name. Source, size and haul distance set what arrives and what it costs.
Read more
Soil Connect vs Hello Gravel: Sourcing fill & aggregate for job sites

Hello Gravel sells bulk stone online at a posted delivered price. Soil Connect matches fill and aggregate between nearby job sites.

Read more
Soil Connect vs DirtMatch: Which dirt marketplace fits contractors?

DirtMatch fits small jobs and pros who work their own matches. Soil Connect fits contractors who want trucks booked and loads logged.

Read more
Soil Connect vs Aggregate Markets: Bulk material ordering compared

Aggregate Markets sells priced quarry stone and soil. Soil Connect matches dirt imports and exports between job sites.

Read more
Soil Connect vs HaulHub: eTicketing for dirt haulers compared

HaulHub handles DOT and plant tickets on public roadwork. Soil Connect ties etickets to a dirt marketplace and fast hauler pay.

Read more
Crushed stone vs gravel: Which base material to order

Crushed stone is the base to order when a layer carries trucks. Gravel suits drainage and finish work, because its rounded stone rolls under load.

Read more
How to convert tons to cubic yards for dirt, sand & gravel

Divide the tons by the material's weight per cubic yard. Dry 1/4 to 2 inch gravel runs about 1.43 tons a loose yard and wet about 1.7, so moisture moves the answer.

Read more
How to dispose of contaminated soil from a job site

Test the soil, classify it under RCRA, then haul it on the right paperwork to a permitted facility. Your state agency and consultant set the details.

Read more
Borrow pit guide: How contractors source & permit borrow material

A borrow pit supplies raw soil for fill. Permits, reclamation and haul distance set its real cost.

Read more
Fill dirt vs topsoil: Which one your project actually needs

Fill dirt builds grade and carries load. Topsoil grows grass. Many sites need both: compacted fill below, at least 4 inches of topsoil wherever grass will grow.

Read more
How to compact fill dirt so it does not settle

Fill settles least when it goes down in thin lifts near optimum moisture, gets the right compactor and passes a density test before the next lift.

Read more
How Contractors Are Monetizing Excess Dirt On-Site

Contractors are turning excess dirt into revenue by matching local supply with demand, reducing disposal costs and improving project margins.

Read more
Understanding Fill Quality: When Cheap Dirt Gets Expensive

Fill quality directly impacts compaction, inspections, and long-term performance — and low-cost fill can quickly become expensive if quality is overlooked.

Read more
How Jobsite Dirt Matching Reduces Risk, Not Just Cost

Jobsite dirt matching reduces schedule risk, supply disruption, and rework while improving cost control and material visibility.

Read more
Why Efficiency Is the Key to Winning More Profitable Jobs

Efficiency across sourcing, hauling, and logistics helps contractors reduce cost, improve schedule reliability, and win more profitable jobs.

Read more
The Biggest Hidden Cost Drivers in Earthwork Projects Today

Hidden cost drivers like haul distance, idle time, and poor supply visibility quietly erode earthwork project margins.

Read more
How Smarter Material Sourcing Helps Contractors Protect Profit

Smarter material sourcing improves visibility, reduces haul distance, and helps contractors protect profit across every phase of a project.

Read more
Cost Control in Sitework: The New Competitive Advantage

Cost control in sitework now depends on visibility, logistics efficiency, and local material connections — not just price per yard.

Read more
Where Construction Margins Are Disappearing — And How to Protect Them

Contractors are losing margins through small sourcing, hauling, and scheduling inefficiencies. Smarter material visibility and local sourcing help protect profit.

Read more
Why Shorter Hauls Matter More Than Ever in 2026

Shorter hauls reduce fuel risk, improve labor efficiency, and help contractors maintain reliable schedules in today’s tighter construction environment.

Read more
What Contractors Get Wrong About Fill Pricing

Fill pricing mistakes often come from overlooking material type, haul distance, availability, and schedule risk. Contractors who understand the full cost of sourcing fill can reduce delays, control budgets, and protect margins.

Read more
Local Dirt vs Long Hauls: Where Projects Really Lose Money

By sourcing material closer to the jobsite and improving visibility into local supply, contractors can reduce risk, control schedules, and protect margins.

Read more
Clean Fill Pricing Explained: Do You Know What You’re Paying?

Clean fill pricing varies more than most contractors realize, driven by distance, demand, and material requirements.

Read more
Material Specs That Matter: What Every Contractor Should Know Before Ordering Fill

Understanding fill material specs helps contractors avoid rework, reduce delays, and control project costs before trucks ever arrive.

Read more
Hidden Costs of Hauling: How Distance Eats Into Your Project Budget

Digital marketplaces like Soil Connect are reducing hauling distance, cutting hidden costs, and helping contractors keep projects on schedule.

Read more
Seasonal Dirt Costs: How Weather and Demand Affect Your Bottom Line

Weather and demand drive seasonal dirt pricing, and contractors using digital tools are better positioned to control costs year-round.

Read more
The Dirt Exchange Economy: How Matching Supply and Demand Saves Millions

Digital marketplaces like Soil Connect are reducing waste, cutting costs, and helping contractors match surplus dirt to demand faster.

Read more
Smart Hauling Strategies: Reducing Idle Time and Maximizing Every Load

Digital platforms help contractors reduce hauling delays, maximize loads, and keep projects moving efficiently.

Read more
Cubic Yard Confusion: Why Truck Capacity Isn’t Always What It Seems

Contractors are reducing surprises and cutting hauling costs by understanding how real truck capacity differs from advertised cubic yards.

Read more
Jobsite to Jobsite: Why Local Dirt Matches Are the Future of Construction Savings

Local dirt matches are helping contractors cut hauling costs, speed up sourcing, and keep projects running efficiently.

Read more
The True Cost of Delays: How Faster Dirt Matches Keep Projects on Schedule

Digital marketplaces like Soil Connect help contractors avoid delays by matching dirt and haulers faster, cutting costs and keeping projects on schedule.

Read more
The Dirt Exchange Economy: How Matching Supply and Demand Saves Millions

Digital marketplaces like Soil Connect are streamlining sourcing, cutting costs, and connecting contractors faster.

Read more
How Transparent Pricing Transforms Contractor Relationships

Digital marketplaces like Soil Connect are streamlining sourcing, cutting costs, and connecting contractors faster.

Read more
Beyond the Dirt: Why Digital Marketplaces Are Changing the Construction Game

Digital marketplaces like Soil Connect are streamlining sourcing, cutting costs, and connecting contractors faster.

Read more
Hauling Efficiency 101: Tips to Reduce Empty Loads and Wasted Trips

Every mile and load matters. Learn how smarter route planning and digital tools are helping contractors reduce empty trips and boost hauling efficiency.

Read more
Quarry vs. Marketplace: Which Source Delivers Better Value for Fill?

Quarries offer reliability — but digital marketplaces deliver flexibility, speed, and savings. Learn how contractors are getting more value from every load.

Read more
Cutting Out the Middleman: How Contractors Can Take Control of Dirt Costs

Contractors are saving time and money by cutting out the middleman. Learn how direct digital connections help you control costs and streamline operations.

Read more
From Surplus to Savings: Turning Your Excess Dirt Into Revenue

This blog explains how contractors are saving money and earning revenue by matching surplus material with local demand through digital marketplaces like Soil Connect.

Read more
Dirt Disposal Costs: The Hidden Budget Drain on Construction Projects

This blog breaks down why disposal is so expensive — and how digital tools like Soil Connect help contractors save by connecting surplus dirt with nearby demand.

Read more
What Is the Market Rate for Common Fill: Do You Know What You’re Paying?

Common fill is one of the most widely used materials in construction — but are you paying a fair rate? Prices vary widely depending on supply, hauling, and middlemen markups.

Read more
The Dirt Exchange Economy: How Matching Supply and Demand Saves Millions

In construction, dirt is money — and the old model of buying fill and dumping excess is costing contractors more than they realize. The dirt exchange economy changes that by connecting jobsites with complementary needs, reducing waste, hauling costs, and delays. Learn how this smarter model is already saving millions across the industry.

Read more
From Quarry to Jobsite: Tracing the Real Journey of Construction Materials

In this post, we trace the full lifecycle of construction materials, from sourcing and processing to hauling, delivery, and backhauling. Learn how understanding this journey helps contractors cut costs, avoid downtime, and optimize every project.

Read more
Seasonal Dirt Costs: How Weather and Demand Affect Your Bottom Line

How rain, snow, heat, and demand cycles impact dirt pricing — and strategies contractors can use to plan ahead, reduce costs, and protect their margins.

Read more
Quarry Dirt vs. Jobsite Dirt: What Contractors Need to Know

Most contractors find the best results using a smart mix of dirt. Knowing when to choose which type can save thousands.

Read more
How Much Money Can You Really Save by Matching to Dirt from Another Jobsite?

Dirt costs are one of the most overlooked expenses in construction. Here’s how smarter dirt management can put thousands back in your pocket.

Read more
How Many Cubic Yards Are Really In A Truck?

See how weight limits, material density, and truck type affect how many cubic yards you can really haul in one trip.

Read more
Geotech Reports Decoded: What Material Specs Mean for Your Bottom Line

Geotechnical reports may look technical, but the material specs inside them shape everything from sourcing to profit margins.

Read more
Screened vs Unscreened Fill Dirt: Which Should You Use?

Read more
Structural Fill Dirt: Key Benefits for Your Build

Read more
The Future of Dirt Brokering: Tech-Driven Solutions for a Manual Industry

Dirt brokering is evolving. Digital tools like Soil Connect’s Marketplace are streamlining material sourcing, reducing costs, and eliminating manual headaches—making life easier for contractors, haulers, and suppliers alike.

Read more
Dirt and Aggregate: Selecting the Ideal Material Mix

Read more
Engineered Fill Dirt: Custom Solutions for Stable Construction

Read more
Dirt Hauling Contracts and Agreements: Navigating Risk

Read more
How to Evaluate Local Soil Suppliers for Your Next Project

Read more
A Contractor’s Guide to Ordering Bulk Clean Fill Dirt

Understanding the distinction between clean fill dirt and regular soil is critical when planning any site development.

Read more
5 Key Benefits of Using Clean Fill Dirt for Your Project

Clean fill dirt is often an overlooked hero in construction and landscaping, providing a reliable, contaminant-free foundation for projects of all sizes.

Read more
National Dirt Trends: What We’re Seeing in Pricing and Availability in 2025

Fill dirt prices and availability are shifting in 2025. This post covers key regional trends, rising hauling challenges, and how contractors can stay ahead.

Read more
Digital Load Tracking: Why It’s a Game Changer for Construction Projects

Digital load tracking transforms the process by providing real-time visibility, eliminating paper tickets, and streamlining reporting and invoicing — helping contractors save time, cut costs, and stay competitive.

Read more
Bidding Smarter: How to Win More Earthwork Jobs with Soil Connect

Winning earthwork jobs in today’s market isn’t just about offering the lowest price — it’s about bidding smarter. Learn how Soil Connect helps contractors tighten up material sourcing, secure better hauling rates, and track every load in real time, so you can build competitive, profitable bids and win more work.

Read more
How to Save Thousands on Your Next Dirt Import or Export Project

Learn proven ways to cut costs on dirt import and export jobs, from smarter hauling strategies to listing best practices.

Read more
What Makes a Dirt Listing Stand Out? Tips from Our Marketplace Experts

Our experts share tips on setting competitive prices, writing clear descriptions, and including key pickup details to attract more responses and get your material off-site quicker.

Read more
Comparing Flat-Rate vs. Hourly Dirt Hauling Services

Choosing the right hauling cost structure can make or break your project's budget.

Read more
Negotiating Bulk Soil Purchases to Save on Material Costs

Sourcing large quantities of soil may seem like a basic task, but the strategy behind it can greatly affect your project’s bottom line.

Read more
How Shorter Trucking Distances Lower Your Project’s Environmental Footprint

How reducing trucking distances cuts emissions, saves fuel, and keeps your projects on schedule.

Read more
How Can You Tell What You Are Actually Spending On Dirt?

Uncover the hidden costs of dirt and aggregate in your construction projects and learn how to manage your budget more effectively.

Read more
Clean Fill Dirt: Why It’s Essential for Landscaping Projects

Before planting flowers, laying turf, or pouring concrete, it's essential to establish a solid foundation for your outdoor project.

Read more
How to Determine the Best Select Fill Dirt for Residential Construction

When planning any landscaping or construction project, the type of soil you use is the backbone of your results.

Read more
Dirt Hauling: Tips for Coordinating Pickup, Delivery, and Disposal

Whether it’s digging foundations, leveling land, or cleaning up after demolition, dirt hauling services play a central role in keeping the job running smoothly.

Read more
Top Types of Fill Dirt and Their Construction Applications

Choosing the right type of fill dirt is one of the most important decisions in any construction project.

Read more
Find Dirt Online: What to Know Before You Buy or Sell Soil

In the past, finding quality soil meant relying on local suppliers, hoping they had the right type in stock, and arranging transportation yourself.

Read more
What Is a Dirt Marketplace and Why You Should Be Using One

Moving large amounts of dirt used to require a chain of phone calls, paper forms, and repeated coordination. Digital platforms are transforming how soil is bought, sold, and transported.

Read more
Top 5 Things to Know Before Hauling Clean Fill Across State Lines

Key tips for hauling clean fill across state lines and staying compliant with ease.

Read more
Maximizing Efficiency in Construction: The Role of Digital Tools

Discover how digital tools boost jobsite efficiency, streamline hauling, and improve project tracking.

Read more
The Benefits of Diversifying Your Dirt Offerings: Sand, Gravel, and Beyond

Choosing the right material for each job is a crucial part of ensuring that projects stay on schedule and meet their objectives.

Read more
The Advantages of Using Select Fill Dirt in Foundation Preparation

In construction projects, the materials used beneath the surface are just as important as those placed above it. One of the most vital materials is select fill dirt, a specific type of soil chosen for its stability and consistency.

Read more
Select Fill Dirt Vs Common Fill: What’s The Difference?

Fill dirt is a crucial material used in many construction projects, and understanding its basic nature is essential for every project owner.

Read more
How Dirt And Aggregate Impact Construction Site Stability

In construction projects, the proper use of dirt and aggregate plays an essential role in ensuring the stability of the site and the longevity of the structures built on it.

Read more
Key Benefits of Using Digital Dirt Marketplaces for Sourcing Soil

Traditionally, sourcing soil for construction and landscaping projects has been a laborious process, involving multiple phone calls, site visits, and negotiations.

Read more
Understanding Plasticity Index: What It Means for Soil Performance

Understanding the Plasticity Index (PI) of soil is crucial in fields like construction and engineering.

Read more
The Atterberg Limits Explained: LL, PL, and PI

Understanding the Atterberg limits is crucial in the construction industry because these limits help determine the suitability of soil for various construction projects

Read more
Plasticity Index and Soil Type: A Guide for Builders

Understanding soil plasticity is crucial for any construction project because it directly affects the soil's ability to change shape without cracking or losing strength under pressure.

Read more
Soil Stabilization: Reducing Plasticity Index with Industrial Waste

Soil stabilization is a critical engineering practice aimed at enhancing soil strength and durability to support construction projects.

Read more
Screened vs. Unscreened Fill Dirt: Pros and Cons

The quality of fill dirt significantly affects construction projects' structural integrity and longevity.

Read more
Comparing Fill Dirt Types for Safe Septic System Installation

Understanding the fill dirt for the septic system is crucial for successful installation.

Read more
Building Foundations with Clay Fill Dirt: What You Need to Know

The stability of any building depends significantly on the type of soil on which it is constructed.

Read more
Dirt Marketplaces: How They Are a Game-Changer for Small Contractors

In the fast-evolving construction sector, digital platforms for dirt trading have emerged as transformative tools, particularly for small contractors.

Read more
How to Build a Reliable Network of Dirt Suppliers and Buyers

In the world of construction, the availability and quality of materials can dictate the pace and success of projects. A reliable dirt supplier network is essential because it ensures that high-quality soil is available when needed, preventing delays and reducing costs. Managing a dependable supply chain allows for better project planning. It also positions businesses to respond quickly to market demands, a crucial factor in maintaining competitiveness in the construction industry.
Read more
Exploring the Growing Demand for Gravel in the Construction Industry

Gravel is a fundamental component widely utilized across various construction sectors.

Read more
How to Plan Your Dirt Hauling for Maximum Efficiency

Efficient dirt hauling is crucial for any construction or landscaping project, impacting timelines and budgets.

Read more
The Essential Types of Dirt and Their Uses in Construction

Selecting the appropriate type of dirt for construction projects is critical due to its fundamental role in the structures' stability and durability.

Read more
How to Start a Profitable Dirt Brokerage Business: A Step-by-Step Guide

Dirt brokering involves the buying and selling of large quantities of soil commonly used in construction, landscaping, and agricultural sectors.
Read more