
November 14, 2026


TL;DR
Construction and demolition waste, or C&D waste, is the debris from building, renovating and demolishing buildings, roads and bridges. EPA tracks seven materials in it and leaves land-clearing debris out, and soil is not one of the seven, so the national total says nothing about site dirt.
Construction waste recycling looks high by weight, and two materials carry it. In 2018, EPA counted 600 million tons of construction debris: 457 million directed to a next use, 313 million of them as aggregate, and 144 million sent to landfills. Concrete and asphalt pavement supplied 436 of the 457 million. Demolition waste made up 94.5% of the total and waste during construction only 33 million tons. The EPA C&D materials guidance names the seven materials behind them: concrete, asphalt concrete, wood, drywall and plaster, asphalt shingles, brick and clay tile, and steel.
Million tons, 2018
Table: Where C&D debris went
| Group | Million tons |
| Aggregate | 313 |
| Landfill | 144 |
| Manufactured products | 132 |
| Fuel | 7.5 |
| Compost & mulch | 2.5 |
| Soil amendment (gypsum) | 1.9 |
Source: EPA, 2018
Million tons, 2018. Share: landfilled over generated.
Table: Landfill share by material
| Material | Generated | Landfilled | Share |
| Brick & clay tile | 12.3 | 10.8 | 88% |
| Drywall & plaster | 15.2 | 13.2 | 87% |
| Asphalt shingles | 15.1 | 13.0 | 86% |
| Wood | 40.8 | 29.6 | 73% |
| Steel | 4.7 | 1.1 | 23% |
| Concrete | 405.2 | 71.2 | 18% |
| Asphalt concrete | 107.0 | 4.9 | 5% |
Source: EPA, 2018
By weight the rate looks strong. Wood, drywall and shingles still mostly end up in landfills.
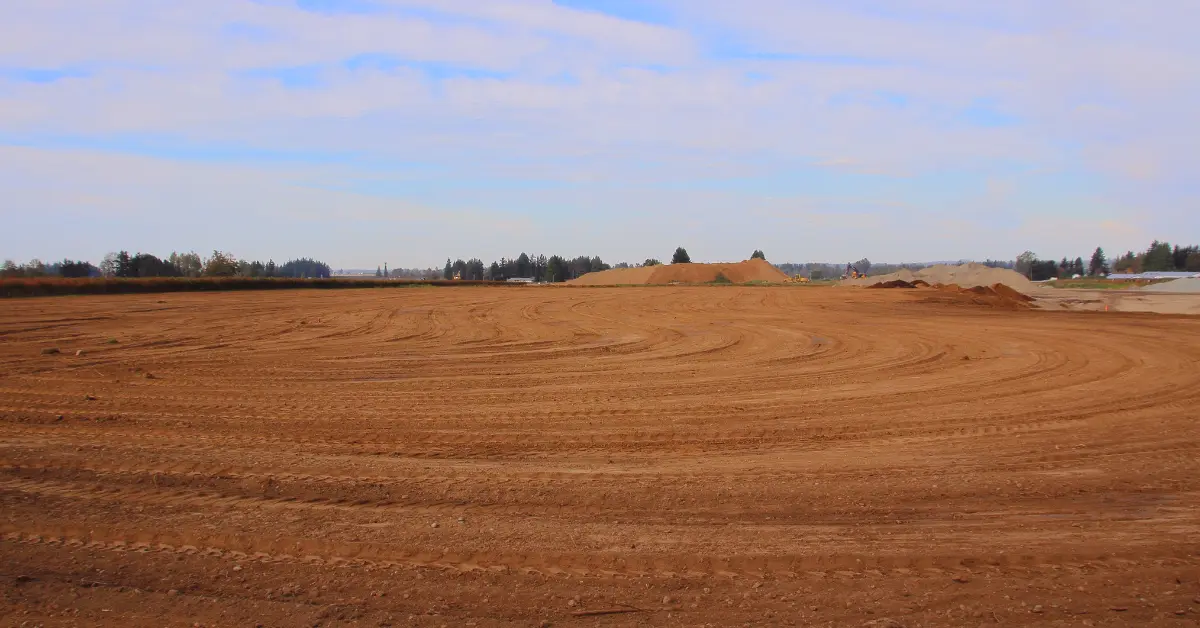
We found no federal count of where construction site dirt ends up. EPA's generation estimate excludes debris from land clearing, and its 2015 methodology memo says why: its management is decentralized and not tracked, such as at the point of generation. EPA's general definition of C&D materials lists earth and rock from clearing sites. Its tonnage does not.
State landfill surveys come closest. Minnesota's composition study weighed 1,699 tons across 375 loads at seven disposal facilities in 2019 and found dirt, sand, rock and gravel at 13.4% of the C&D stream by weight, dirt and sand alone at 6.5%. Those are loads that reached a C&D disposal facility. Dirt reused on site or trucked to another job never enters such a survey, nor does construction waste disposal that bypasses a permitted facility.
Soil Connect's own pages add two figures. Its Find Dirt page lists 182 million+ yards of dirt matched between sites. The page gives no time frame. Its Dirt Reports page says its data shows a 24% to 30% difference between estimated and actual dirt import and export volumes.
On Soil Connect's blog, landfill diversion for dirt is a matching problem. Its posts describe contractors monetizing construction site dirt by redirecting it to another job site instead of a dump, and avoiding the hidden disposal costs of hauling and tipping fees. The Get Rid of Dirt service is Soil Connect's route: its Dirt Pros help with hauling to a closer location, per the page.
Percent of tons, 2019
Table: What Minnesota's C&D disposal facilities took in
| Group | Percent of tons |
| Concrete | 21.8% |
| Roofing shingles | 19.3% |
| Dirt, sand, rock & gravel | 13.4% |
| General C&D | 10.5% |
| Treated, painted & processed wood | 8.3% |
| Gypsum board | 8.1% |
| Brick | 7.2% |
| Clean wood | 7.2% |
Source: Minnesota PCA, 2019
We found no national count of site dirt. Your load tickets are the record of where yours went.
A good diversion rate is the one the governing code or rating system sets, and CALGreen and LEED both leave excavated soil out of the math. CALGreen, California's mandatory green code, requires newly constructed buildings and demolition projects to divert at least 65% of the C&D materials generated on site, under Sections 4.408 and 5.408, per CalRecycle's summary of the 2019, 2022 and 2025 requirements and HCD's 2025 residential checklist. Demolition-only permits fall outside the code, per CalRecycle. CalRecycle's 2020 briefing adds that excavated soil and land-clearing debris are not included in the diversion calculation. On non-residential projects, Section 5.408.3 separately requires 100 percent of trees, stumps, rocks and associated vegetation and soils resulting primarily from land clearing to be reused or recycled.
LEED v5 BD+C, USGBC's February 2026 edition, gives 1 point at 50% diversion and 2 at 75%, with minimum salvaged or source-separated shares, and excludes excavated soil and land-clearing debris. The older LEED v4.1 gives one point at 50%, excludes the same soil and debris, and counts alternative daily cover as waste, not diversion.
CALGreen diversion rate: 65% of C&D materials generated on site must be diverted from landfills on newly constructed buildings and demolition projects in California, per CalRecycle. Demolition-only permits fall outside the code, per CalRecycle. (Source: CalRecycle, 2019, 2022 & 2025 editions: CalRecycle for the rule and the demolition-only scope, California HCD for the 2025 residential section)
Recycled concrete supplies most of the C&D next-use total, 334 of 457 million tons. EPA's 2018 accounting sent 301 of 405 million tons of C&D concrete to aggregate, 33 million tons into manufactured products and 71 million tons to landfills, whether a C and D landfill or another type. EPA's table does not split them. USGS lists 37 million metric tons of recycled material in its 2025 crushed stone table and says recycled material's share of total aggregate remained very small. The two do not reconcile: EPA's is an estimate of C&D concrete bound for aggregate in short tons, USGS's a supply line in metric tons.
Soil reuse has no EPA table. Soil Connect says its customers save 28% to 42% on their dirt, per its Get Rid of Dirt page, and its Contractors page puts the logic in five words, shorter haul distances = big savings. Its post on how a dirt exchange saves money calls one site paying to dump while a nearby site pays to import a double cost a match removes.
Million tons, 2018
Table: Where C&D concrete went
| Group | Million tons |
| Aggregate | 301 |
| Landfill | 71 |
| Manufactured products | 33 |
Source: EPA, 2018
Concrete has an EPA line and a next-use figure. Site dirt has neither.
All sources, checked November 6, 2026
Frequently asked questions
About 144 million tons in 2018, or 24% of the 600 million tons of construction and demolition debris EPA counted. The other 457 million tons went to a next use, mostly as aggregate. By material, EPA's tables put concrete at 18% landfilled and asphalt pavement at 5%, while wood, drywall, shingles and brick each exceeded 70%.
Not in EPA's national estimate. EPA's definition of C&D materials lists earth and rock from clearing sites, but its generation figures cover seven materials, and its 2015 methodology memo says land-clearing debris was not included. Minnesota's landfill study does see it: dirt, sand, rock and gravel were 13.4% of disposed C&D by weight in 2019. CALGreen, LEED v4.1 and LEED v5 all exclude excavated soil from their diversion calculations.
Use the rule that governs your project. CALGreen requires at least 65% diversion of C&D materials on newly constructed buildings and demolition projects in California, with excavated soil and land-clearing debris left out of the calculation. Demolition-only permits fall outside the code, per CalRecycle. On non-residential projects, soils and other material resulting primarily from land clearing must be reused or recycled at 100%. LEED v5 gives 1 point at 50% diversion and 2 at 75%, with minimum salvaged or source-separated shares.
Keep reading
Create an RFQ or Post and learn how much dirt near you actually costs.